


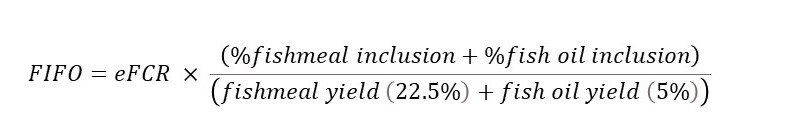
Fish in: Fish out ratio calculation
|
Species |
2000 |
2010 |
2020 |
|---|---|---|---|
|
Crustaceans |
1.61 |
0.83 |
0.45 |
|
Marine Fin Fish |
2.21 |
0.98 |
0.75 |
|
Salmonids |
3.03 |
1.87 |
0.93 |
|
Eels |
2.86 |
1.51 |
1.34 |
|
Cyprinids |
0.09 |
0.03 |
0.01 |
|
Tilapias and other cichlids |
0.63 |
0.25 |
0.11 |
|
Freshwater Fish |
0.71 |
0.44 |
0.29 |
|
Turtles and Frogs |
1.34 |
0.85 |
0.73 |
|
Total Fed Aquaculture |
0.47 |
0.28 |
0.19 |
For this update we have revised the composition of each category/family. This is to reflect the expansion of aquaculture over the last 10 years, both in terms of species farmed and tonnage produced.
In general there is a continued reduction in the FIFO figures, reflecting the use of fishmeal and fish oil as strategic ingredients at key points in aquaculture production cycles with a trend towards optimising their nutritional contributions. The overall fed aquaculture figure shows a marked decrease to 0.19, essentially meaning that for every 0.19kg of whole wild fish used in fishmeal production, a kilo of farmed fish is produced. In other words, for every 1 kg of wild fish used 5 kg of farmed fish is produced. There has been a reduction across all categories, but of particular note is the figure for salmonids, which for 2020 is seen to be below 1.0, i.e. the salmonid feed industry supports the production of more farmed fish than it uses as feed fish. On the whole this is a very positive message about the contribution that marine ingredients make to global protein production. The marine ingredients industry supports the production of a significantly greater volume of protein for humanity than would be supplied merely through the direct consumption of the fish used as raw material in the production process.
Full species list under each category is available here.